TXF Weekly Momentum, Long-Only: Lose Less in Sell-offs, Earn Less in Rallies
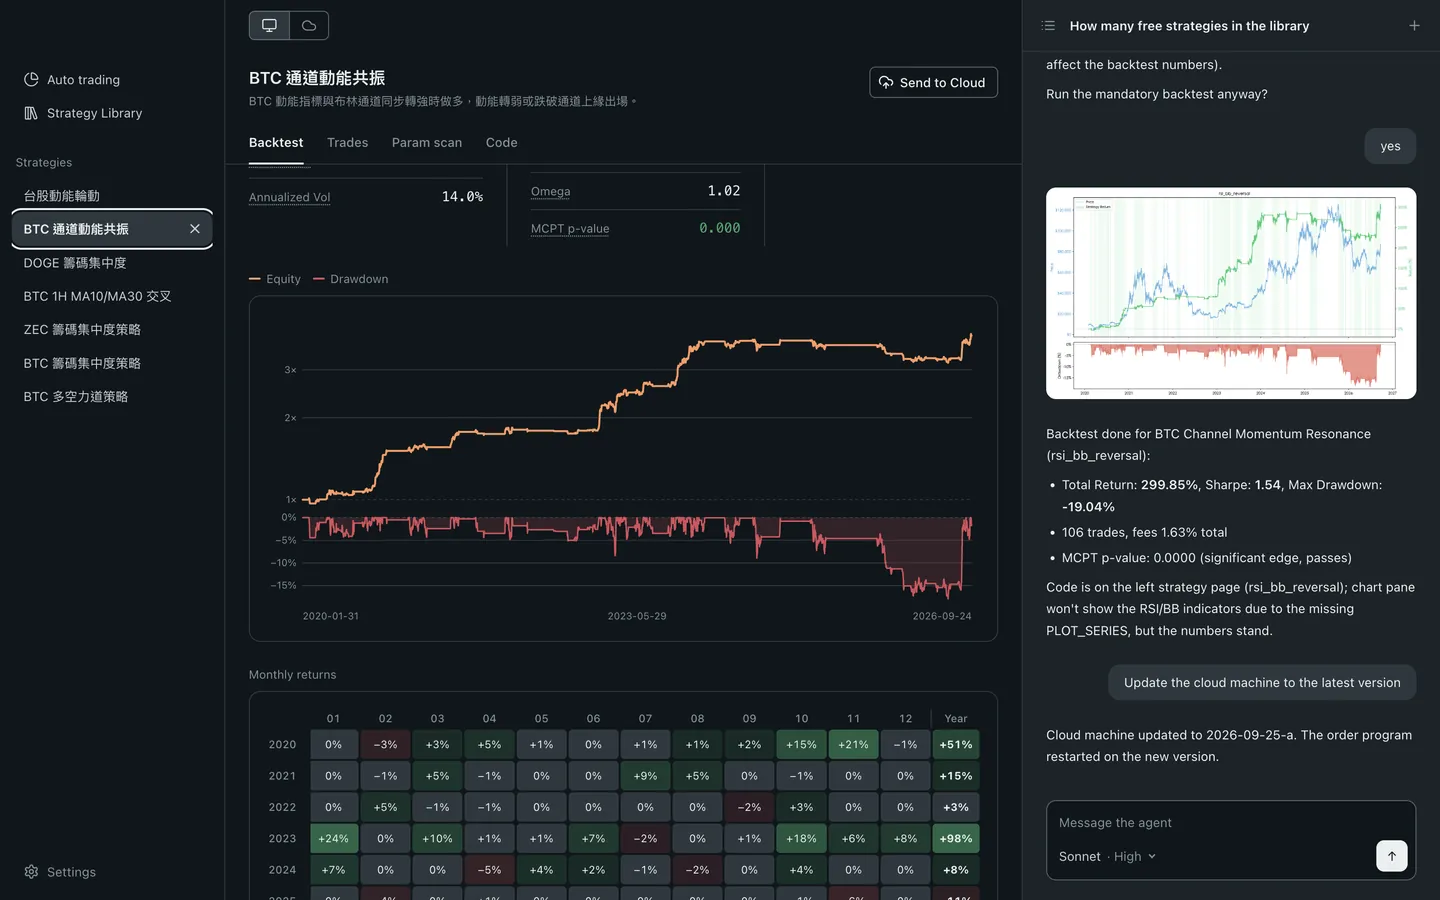
Taiwan index futures nearly quadrupled in eight years, so simply holding them paid off. This strategy doesn't try to beat that return. It tries to lose less when the market falls. This TAIEX futures (TXF) strategy, Weekly Momentum Long-Only, asks one question: is the past week's move unusually strong compared with the market's normal volatility over the last month? If it is, it goes long one contract. It exits to cash only once the move turns clearly weak, and it never shorts. Backtested from August 2018 to November 2026, it returned +284.9% in total, about 17.5% a year, with a Sharpe ratio of 1.33 and a maximum drawdown of −23.3%. Holding TXF the whole time and rolling every month earned more (+377.5%), but with a −27.2% max drawdown and a Sharpe of 1.03. What the strategy buys you is a smoother equity curve. The price is earning less in strong bull years. How is "a strong week" measured? The strategy takes TXF's price change over the past week (about 5,700 one-minute bars across day and night sessions) and divides it by the normal one-week volatility, estimated from the last month. That gives a standardized score. A 2% gain counts as strong in a calm market and as noise in a wild one. A score above +0.5 opens a long. The position is closed only when the score falls below −0.5. Between those levels nothing happens, which keeps it from flipping in and out around a single threshold. The rule is checked at every one-minute close. On each monthly settlement day the position is closed at 13:29. When the night session opens, if the score is still in the holding zone, the strategy re-enters in the new contract month. Returns and volatility are computed on a price series adjusted for the gap between contract months, so the roll itself is never mistaken for a market move. Why long-only, with a fixed position? TXF has trended up over the long run, and shorting means fighting that trend. So this strategy only goes long and steps aside to cash when momentum fades. The position is always one contract, with no leverage, and in the backtest it held a position on about 64% of trading days. In 2022, rolled TXF fell 17.7% while the strategy lost 7.2%. In the late-2018 sell-off, holding lost 11.2% and the strategy lost 3.4%. Backtest results (Aug 2018 – Nov 2026, 1-minute bars) MetricStrategyHold and roll monthlyTotal return+284.9%+377.5%Annualized returnabout 17.5%about 21.6%Sharpe ratio1.331.03Max drawdown−23.3%−27.2%Trades398 (including monthly roll re-entries)—MCPT p-value0.006 (only 6 of 1,000 random shuffles did better)— When you run the backtest yourself, the report lists a benchmark return of +279.4%. That figure stitches the contract months' prices together end to end, so every roll gap is counted as a price move. Someone who actually holds and rolls each month doesn't get that number. They get the +377.5% in the table, so that's the comparison used here. YearStrategyHold and roll monthly2018 (from Aug)−3.4%−11.2%2019+17.4%+31.0%2020+33.4%+37.3%2021+33.3%+28.9%2022−7.2%−17.7%2023+16.9%+28.4%2024+20.8%+25.9%2025+14.1%+28.0%2026 (to Nov 5)+27.8%+36.2% Results include a cost of 0.01% per side. These are backtest results, not a promise of future performance. Four things to be honest about ① In most years it earns less than simply holding. It beat holding in only three of nine years (2018, 2021, 2022). In 2019, 2023 and 2025 it trailed by more than ten percentage points. If you want the most return, holding is the better choice. This strategy is for people who care about drawdowns and want to sit out the down stretches. ② The parameters were chosen on the same data, and there is no out-of-sample test. Around the ±0.5 thresholds, neighboring settings average a Sharpe of 1.25, which is 0.95 of the chosen setting, so the result is stable. But the indicator itself changed during development: first from a raw weekly return to a volatility-scaled one, then to a roll-adjusted price. The more versions you try, the more optimistic a backtest tends to be, so live results will most likely come in below the backtest. ③ Some of the 398 trades are monthly rolls. Each roll closes the position on settlement day and reopens it at the night-session open, and every roll pays costs again. On one-minute bars, slippage worse than the backtest assumes would take a real bite out of returns. ④ When settlement day is pushed back by a holiday such as Lunar New Year, the settlement-day check can occasionally be off by one day. That has happened about once or twice in eight years. The rules fit in a few lines. Running them every minute without a miss is the hard part. The logic is all above. The real work is computing the score every minute across day and night sessions, closing on time on settlement day, deciding at the night-session open whether to re-enter the new month, and never missing a bar. Blave Agent runs that whole chain for you: get this strategy from the library, tell the Agent, and it deploys. See the TXF Weekly Momentum strategy in the library →
Strategies like this can run on your Blave Agent.
Browse ready-made strategies with real backtests →