Skill or Luck in a Backtest: How to Read the MCPT p-value
Where your result lands after the returns are shuffled a few thousand times — and what that number does not answer.
Last updated 2026-09
Key Takeaways
MCPT is a whole-sample permutation test: it shuffles the return series of the backtest period at random (2000 times by default) and counts how many shuffles beat your actual Sharpe. There is no in-sample / out-of-sample split at all.
What gets shuffled is the return series; your entry and exit positions never move — so every permutation carries exactly the same fees and position scaling as the original, and the only thing compared is whether the moments you picked were any good.
It runs automatically on every Type A backtest, with the seed fixed at 42, so the same backtest always yields the same p-value. You never have to ask for it.
The listing gate needs two conditions at once: p < 0.05 and permutations ≥ 1000. On long data the permutation count is cut below 1000 automatically, so even a beautiful p-value fails — and nothing on screen warns you.
Passing does not mean much. In the 2026-09-17 run of the same tutorial example strategy, MCPT p = 0.016 passed, but its out-of-sample efficiency was −0.334. The p-value answers whether skill can be told apart from luck, not whether the strategy will make money.
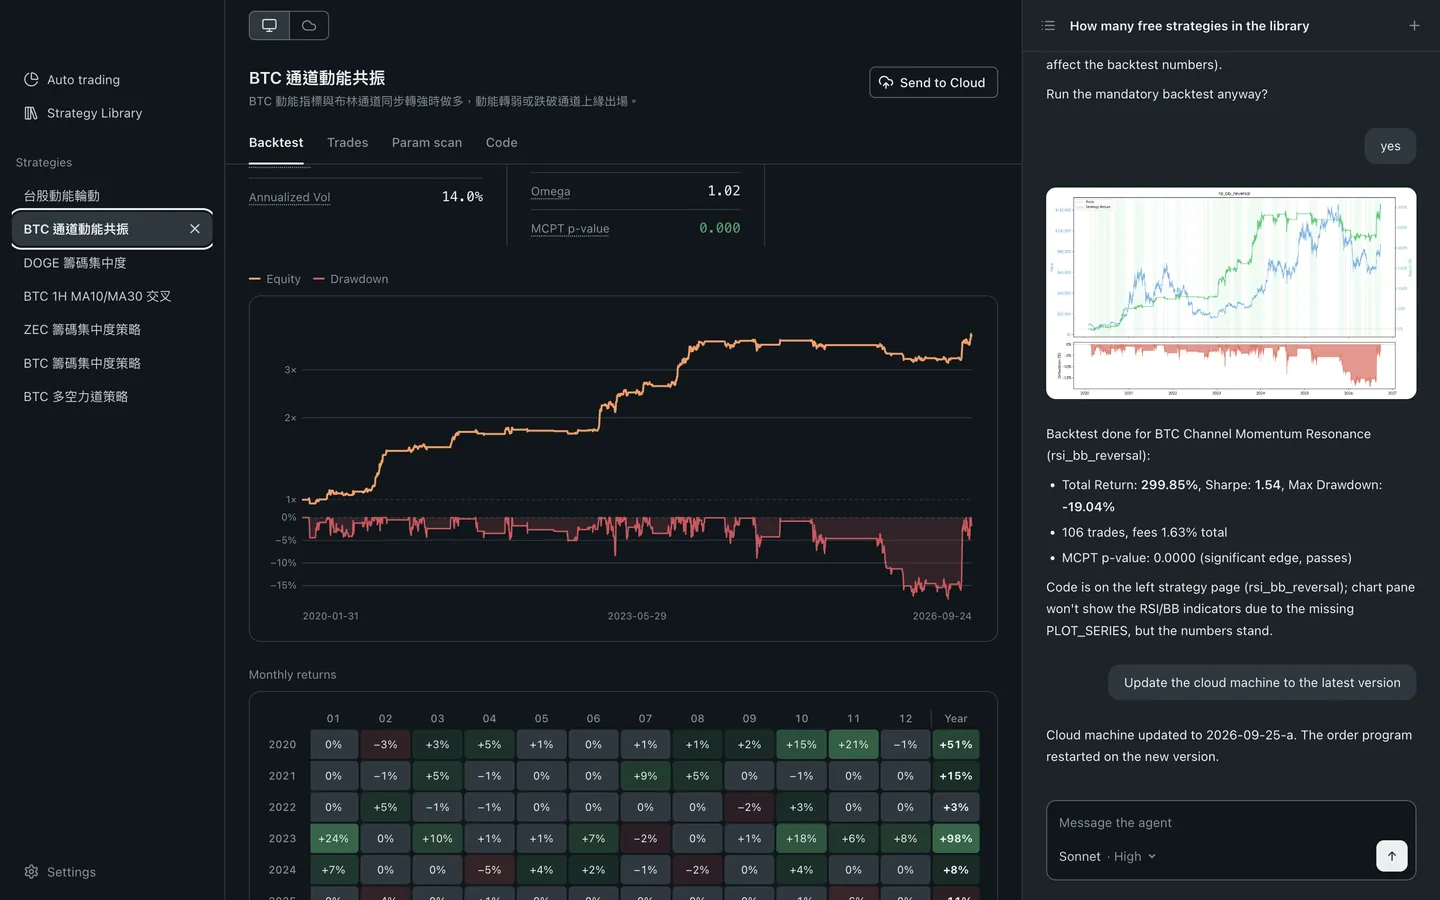
The backtest finishes and the Sharpe looks decent. But the question in the back of your mind is still unanswered: did the strategy really catch something, or did you just hack a few cuts at random inside a rising market? One way to answer it is to shuffle the data a few thousand times and see where your result ranks in that pile of noise — which is exactly what the "MCPT p-value" row on the workspace Backtest tab does. This article covers what it tests, how to read it, and the question it still has not answered once it passes.
What is MCPT?
MCPT (Monte Carlo Permutation Test) is a statistical test: it reshuffles the return series of the backtest period many times over, recomputing Sharpe each time on the same set of entry and exit positions, to build a whole distribution of what pure luck would look like — then checks where your actual result falls on that distribution.
Item
Detail
Null hypothesis
The return periods this strategy picked are no better than randomly picked ones
Definition of p
The share of shuffled Sharpes that are greater than or equal to the actual Sharpe
Reading
p < 0.05 → A statistically significant edge at the 95% confidence level
Test scope
The whole backtest dataset, with no train / test split
The smaller the p-value, the rarer it is that a random shuffle can beat you. With the default of 2000 permutations, p = 0.05 means 100 of those 2000 shuffles did at least as well as you; p = 0.005 means only 10 did.
It shuffles the returns, not your entries and exits
This is the most critical part of the design, and the easiest to misread: what gets shuffled is the forward return series, while your position series stays fixed throughout.
What each permutation does:

position(your positions) ← fixed, computed once outside the loop
× vol_scalar(position scaling) ← fixed, computed once outside the loop
− fee_cost(fees) ← fixed, computed once outside the loop
× shuffled return series ← the only term redrawn each time
= Sharpe of this permutation
Because fees and position scaling are both computed outside the loop, every permutation bears the same trading cost and the same leverage. The only variable left is the order in which the returns arrive — that is, were the moments you picked better than randomly picked moments.
Why not just shuffle the positions instead?
Because that would be a freebie. Shuffling a binary position array creates far more entry and exit switches than the strategy itself ever makes; at fee = 0.0005, every permutation would carry roughly 30 to 40 times the fee drag, and every shuffled Sharpe would be forced deep into negative territory. Whether or not your strategy has a real edge, the p-value would come out beautiful and meaningless.
Tip: Shuffling positions tests whether a wildly over-trading strategy can beat you; shuffling returns tests whether the moments you picked were better than randomly picked ones. The latter is the actual question.
How this p-value gets produced
It is automatic, not optional. It runs once on every Type A backtest, and the result is written straight into the backtest stats and shown on the workspace Backtest tab.
Setting
Default
Note
Permutations
2000
Can be overridden with MCPT_N in the strategy, but is still bound by the budget formula below
Random seed
42
A private generator that never touches the global seed — the same backtest always yields the same p-value
Fee
The strategy's own FEE
Whatever the backtest uses is what gets passed in
Turning it off
MCPT = False
Skipped entirely; no MCPT field is written
Two behaviours worth remembering: MCPT does not run during a parameter scan (one scan is dozens to hundreds of backtests, and adding it would make the scan unusably slow), so the p-value you see always comes from the single backtest run after the parameters were adopted; and once a strategy is live, every live or scheduled trigger carries the same MCPT fields along unchanged — same code, same parameters, so the p-value still holds, which is why a running strategy keeps showing it.
What p-value counts as a pass? The verdict is not made on your machine
The workspace Backtest tab does not judge pass or fail; it only shows the number, plus one line of explanation. When p < 0.05 it reads:
Shuffled {n} times; only {pct} of the shuffles beat it. Below 0.05 is the usual bar.
When it does not pass, it reads:
Shuffled {n} times; {pct} of the shuffles beat it — above the usual 0.05 bar, so this result can't be told apart from luck.
The real pass or fail shows up in the Strategy Library's three quality gates. Gate 2 is called "Statistically significant" and its description reads "MCPT permutation test p < 0.05", while the actual verdict requires two conditions to hold at once:
Condition
Bar
p-value
< 0.05
Permutations
≥ 1000
Portfolio strategy (Type C)
Shows "MCPT n/a (portfolio strategy)"; does not count as a failure
Only when all three gates pass or do not apply does a strategy carry the "Verified" badge. To put the division of labour plainly: your machine only computes the p-value and the permutation count; whether that counts as a pass is the listing side's call.
MCPT on a real strategy: the 2026-09-17 run
Run the tutorial example btc_sma_cross that ships with the workspace once (BTCUSDT 1h, from 2022-01-01, SMA_FAST = 45 / SMA_SLOW = 100, not a single parameter touched, 41,287 bars). Every number below comes from that one 2026-09-17 run.
Backtest
Value
Total return
+123.95%
Benchmark (buy and hold)
+64.36%
Max drawdown
−44.93%
Sharpe Ratio
0.6751
Trades
478
Fees paid (share of principal)
23.90%
MCPT
Value
p-value
0.0160
Permutations
2000
Histogram red line, "Actual Sharpe"
0.8985
Distribution range
−0.8565 ~ 1.4218
The line the backtest prints to stdout itself is:
MCPT p-value: 0.0160 (n=2000, significant edge at 95%)
How to read it: p = 0.0160 means that out of 2000 random shuffles, 32 produced a Sharpe at least as good — in other words, over this stretch of history these entry and exit timings do not look randomly chosen. The permutation count of 2000 is also above the gate's requirement of 1000, so this item passes.
Tip: This is an END = None backtest that runs up to the day it was executed, so it is itself a snapshot. The same strategy in How to Read a Backtest uses a different run, and total return, Sharpe and benchmark all come out different from the figures here. Any backtest number you quote needs its run date attached — including the set you repeat to a friend.
Same strategy: MCPT passed, out-of-sample did not
This is the most important section of the article. On the same day and the same code, that strategy was also put through a walk-forward out-of-sample validation:
Test
The question it asks
The 2026-09-17 run
Result
MCPT
On this fixed position series, can this result be told apart from luck?
p = 0.0160(n = 2000)
Pass
Walk-forward
Does picking parameters from history still work on the next stretch?
One passed, one did not, and neither is miscalculated — because they are simply not answering the same question. MCPT tests whether this already-decided set of entries and exits looks like more than guessing over this stretch of history; walk-forward tests whether the act of picking parameters from history still holds up on the next stretch it has never seen. Passing the former does not imply the latter.
This is not saying the strategy is broken — it is the tutorial example that ships with the workspace, and the point here is the difference in meaning between the two tests. For the full walk-forward numbers and how to read them, see How Out-of-Sample Validation Works.
The "Actual OOS Sharpe" line on the chart is mislabelled
If you ask the agent to plot the MCPT histogram and send it into the chat, the legend on that chart will print a line reading:
Actual OOS Sharpe = ⟨your number⟩
OOS is short for out-of-sample. That line is a leftover label from an old comment; do not read it literally. MCPT runs on the whole backtest dataset from start to finish, with no training window, no test window and no split ratio — it cannot possibly be an out-of-sample figure, and the comparison table above is the proof.
The chart on the workspace Backtest tab does not have this problem: its red line is labelled "Actual Sharpe". Also, the chart in the chat comes from a manual re-run, and a manual re-run does not necessarily use the same parameters as the automatic one, so the numbers on it need not equal the row on the tab.
Trap 1: the permutation count is a bar in itself, and it gets cut automatically
How many permutations the automatic MCPT actually runs is not entirely up to you. There is a runtime budget formula:
actual permutations = min( MCPT_N, 20000, max( 200, 4e8 ÷ bar count ) )
The more bars, the smaller 4e8 ÷ bar count gets. The run above had 41,287 bars, far from the ceiling, so not one of the 2000 permutations was cut. But the comparison recorded in the official documentation reads: 40,000 bars → 2000; 200,000 bars (two years of 5-minute data) → 2000; 1,000,000 bars (two years of 1-minute data) → 400.
The problem is that the listing gate requires permutations ≥ 1000. Working the formula through, once the bar count exceeds roughly 400,000 the actual permutation count drops below 1000 — and the gate fails you even at p = 0.001. Nothing on screen hints at it: the cut is only recorded in the host's log, the workspace explanation text happily reports the cut-down count, and there is no warning styling at all.
Tip: That 400,000 threshold is arithmetic derived from the formula (4e8 ÷ bar count < 1000); the run in this article never triggered it, so it is unverified in practice. The "two years of 1-minute data → 400" figure is the comparison recorded in the official documentation. Also, raising MCPT_Nwill not save you — MCPT_N only lifts the upper bound, and the term that actually holds the count down is max(200, 4e8 ÷ bar count). With too many bars there are only two roads: shorten the backtest period, or move to a longer bar interval.
Trap 2: the Sharpe on the red line is not the same number as the one on the card
Look back at those two tables: for the same backtest, the Sharpe Ratio card says 0.6751 while the histogram's "Actual Sharpe" says 0.8985, a gap of 0.22 that is visible at a glance. This is not a bug; they are two different calculations:
Item
Sharpe inside MCPT(0.8985)
Sharpe Ratio on the Backtest tab(0.6751)
How returns are computed
Simple returns, with no split between the open and the close leg
Overnight leg and intraday leg priced separately
Position scaling
Always applied:30% target volatility、2 × leverage cap
Only if the strategy wrote it in itself
The key is the second row: the automatic MCPT does not pass the strategy's own target-volatility setting through, it always uses the function's defaults. btc_sma_cross does no volatility targeting, yet its MCPT Sharpe is still the number you get "after applying 30% target volatility and a 2× cap" (for what target volatility does, see How Volatility Targeting Works). The two numbers differing is normal; the interface does not explain this today.
No MCPT row on the Backtest tab?
It fails quietly: no error message, the backtest succeeds as usual, and the front end is simply missing that row. There are at least four causes, and the screen does not tell them apart:
Cause
What happened
The strategy wrote MCPT = False
Skipped outright
This backtest made 0 trades
No positions to test, so it is skipped
The lib on the host is an old version
Import fails, so it is skipped
Data too short, Sharpe came out NaN, or any exception
Skipped; the backtest stats are written as usual
The reason for writing nothing rather than writing something wrong is very practical: any NaN or inf makes the whole machine's strategy upload bounce, so the moment the numbers are not clean, these fields are dropped as a group.
Portfolio strategies have no MCPT, and no substitute either
Backtests of Type C strategies (portfolio strategies: N symbols with a weight vector) do not run MCPT. The reason is that the test's structure is "one price series against one position series", and a portfolio strategy does not have that structure. The honest part worth saying out loud: there is no substitute test.
What you want to do
What actually happens
Collapse the whole portfolio into one return series and resample it
That is a bootstrap of realized returns, it answers a different question, and it cannot produce a p-value — the p-value is the entire point of MCPT's existence. This road is explicitly forbidden, and the agent is not allowed to hand-roll something as a stand-in either
What you expect the gate card to show
"MCPT n/a (portfolio strategy)", not "Not passed" — it does not count as a failure and does not affect the "Verified" badge
Once you have a p-value, check these five things first
1
How many permutations? If the count in the explanation text is below 1000, this p-value cannot clear the listing gate no matter how small it is. Read the count first, the p-value second.
2
Which backtest is this p-value from? A parameter scan does not run MCPT. The p-value in your hand belongs only to the backtest run after the parameters were adopted; if the code changed in between, it has to be re-run to count.
3
Red line and card do not match? Normal. The run above was 0.8985 against 0.6751 — different calculations, nothing to debug.
4
Are you reading "significant" as "will make money"? The same strategy can pass at p = 0.016 and crash to an out-of-sample efficiency of −0.334. The p-value makes no statement about the future.
5
The row is missing entirely? First work out which of the four causes it is (strategy turned it off / 0 trades / old lib / not enough data); do not treat it as "the test failed".
An honest reminder: MCPT tests whether this one fixed set of entry and exit positions did well over this stretch of history. It does not know that this parameter set was picked out of hundreds of candidates — the optimistic bias that the picking itself introduces is something it cannot measure. That is why parameters should be picked on a plateau rather than a peak (see How to Avoid Overfitting), and why the strategy in this article passed on p-value and still fell over out of sample. The workspace's own explanation says only that "0.05 is the usual bar" — it is a convention, not a guarantee.
What's next
Once the p-value makes sense, the next question is the right half of that comparison table: does it still hold on a stretch of data it has never seen? That road is out-of-sample validation, and the workspace has its own tab for it. The official strategies in the Strategy Library that carry the "Verified" badge cleared exactly this test at gate 2 — every one of them ships with a real backtest whose numbers you can read directly: Strategy Library.
Let Your AI Do Quanton Your Own Computer
Blave Desktop is free, open source and needs no sign-up. Connect Claude Code or Codex: it writes the strategy, runs the backtest and trades it live.
Downloading.Drag it into Applications,open it, and pick your AI.The first launch sets up its runtimeand takes a few minutes.If you like it, star it on GitHub.
Downloading. When you open the installer, Windows first shows “Windows protected your PC”:
Click “More info”.
Click “Run anyway”. Blave installs and opens on its own.
The first launch sets up its runtime and takes a few minutes.
Windows warns because the installer isn't code-signed yet (we've applied for a certificate), so it can't identify the publisher. The source is public on GitHub. See the full steps