Trading Tools
OI Trading
Market Data
Volatility Trading
Sentiment Trading
Others

Trading Tools
OI Trading
Market Data
Volatility Trading
Sentiment Trading
Others
Analytics
Setting
Token
Indicator


Tool Guide
TutorialAnalytics is Blave's advanced data analysis module. By applying statistical backtesting to historical data, it helps you understand the historical distribution of price upside probabilities under different alpha indicator conditions, to better judge how the market may move.
You can select a token and an indicator, and adjust parameters as needed. After changing any condition, resubmit to update the analysis results and charts.
The X-axis represents the value ranges of the selected alpha indicator, while the Y-axis shows the historical probability of a price rise for each range.
This analysis is updated daily with market data. It is intended solely for historical data analysis and statistical observation, and does not constitute investment advice or trading signals.
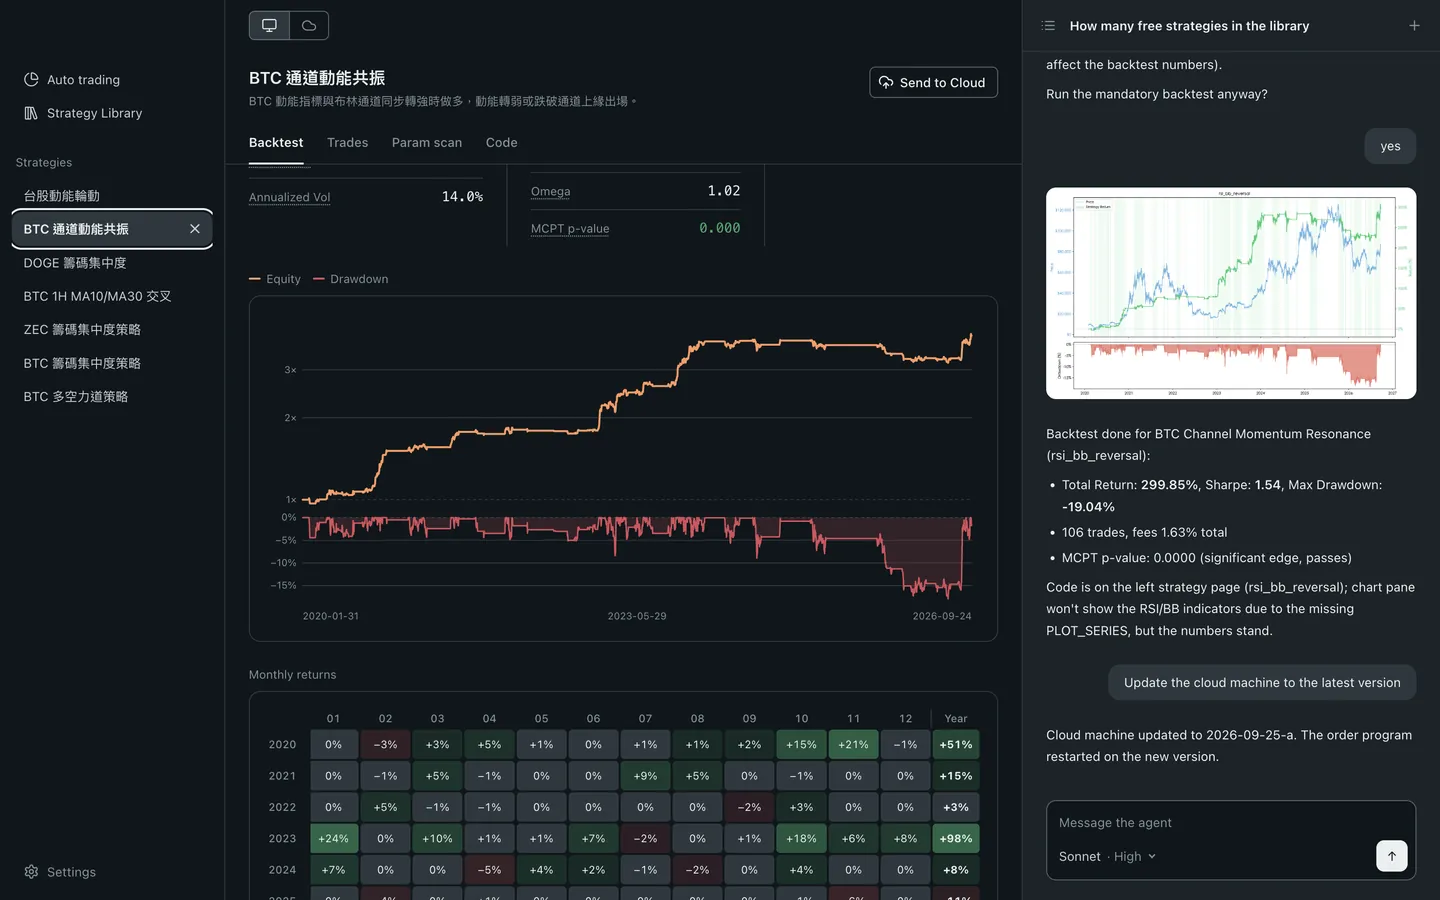
How much time do you spend wiring APIs, pulling data, and debugging — instead of thinking about strategy? Describe the signal, and Blave Agent researches and backtests it.
See what Blave Agent can do →